floodfusion

Sentinel-1 · Sentinel-2 · Copernicus EMS

Flood maps from radar that a duty officer can act on at 3 a.m.

floodfusion maps floods from Sentinel-1 radar, which sees through cloud, and adds Sentinel-2 only where the sky is clear. This page explains how it works and what it achieved. Version 1.1 then tested it on Copernicus EMS maps of flood activations, with questions fixed in advance: the choice of training labels mattered, and the optical input did not detectably. Its charts and results are generated from the reports in the repository.

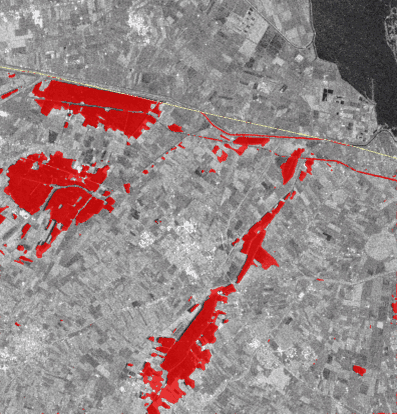
Radar image of farmland near Forlì with the flooded fields mapped in red by floodfusion
Forlì, . Red: the flood floodfusion mapped from Sentinel-1 and Sentinel-2, zero-shot. Compare with Copernicus EMS

IoU on real floods, each scored by a model that never saw it (SAR-only U-Net: )

IoU the fusion model adds where optical is usable, on independent Copernicus EMS maps ( activations; not significant). On Sen1Floods11: +

IoU gained on Copernicus EMS activations by training on flood labels instead of water labels (pre-registered; supported)

1 · The problem

Why mapping floods from space is hard

Floods come with clouds

Optical satellites such as Sentinel-2 see water clearly, but not through cloud, and the storm that floods a valley usually clouds it too. Sentinel-1's C-band radar sees through cloud, day and night. So the map has to stand on radar.

Radar is ambiguous

Calm water is dark to radar, but so are tarmac, dry sand and terrain hidden from the satellite. Wind can make water bright. Flooded forests and streets get brighter. Try the explorer below.

Benchmarks flatter models

When chips of the same flood sit in both training and test, a model is graded on a flood it has already seen. Here every flood is scored by a model trained only on the others.

How dark is it to radar?

Pick a surface to see where it falls on Sentinel-1's VV backscatter scale, and how floodfusion handles it.

Calm flood water

Why: smooth water reflects the radar pulse away from the satellite, like a mirror, so almost nothing comes back.

What floodfusion does: this is the signal it looks for: dark in VV and VH, and darker than the image from before the flood.

Typical Sentinel-1 VV values in dB, approximate: they shift with incidence angle, moisture and season. The noise floor sits near −22 dB.

2 · The pipeline

From satellite archive to flood map

Seven steps, all on public data, with no account or API key needed. Pick a step.

Find matching images

Search Microsoft Planetary Computer's public STAC catalogue for the Sentinel-1 image just after the flood and one from before it, from the same relative orbit, so both images see the ground from the same angle. Sentinel-2 comes from the closest date, plus the Copernicus DEM, JRC permanent water and ESA WorldCover.

Why it matters: two images from different orbits differ because of geometry, not water. Comparing them would invent change.

3 · The fusion idea

Radar first, optical as a gated bonus

The radar features Fs pass straight through. Optical can only add to them, through attention, scaled by a gate g between 0 and 1 that the network predicts for every pixel:

F = Fs + g · Attn(Qoptical, KSAR, VSAR)

  • At g = 0 the network is its own radar path, bit for bit. Without optical it falls back to radar by design. Whether that fallback matches a dedicated radar model, and what a partial cloud does, is tested in section 6.
  • Attention reads only radar features (keys and values), so optical decides where to look, never what the radar measured.
  • Missing optical is a learned embedding, never zeros, and training randomly drops optical (modality dropout) so the radar-only case is practised.
Diagram of the gated fusion: the optical attention path is scaled by the gate g and added to the radar features.

What the gate actually learned

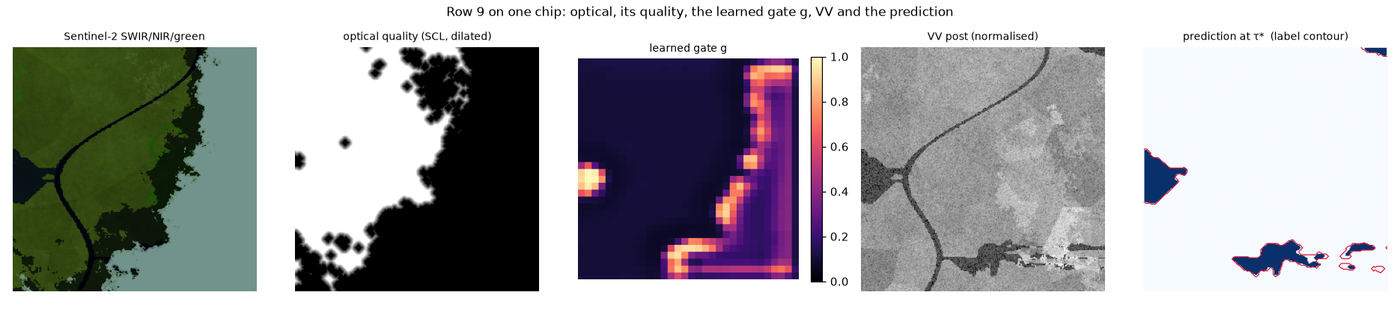
On the synthetic benchmark the gate barely moved from where it started (): its mean over clear pixels is , and it is slightly more open under cloud. There, the network learned that radar suffices: fusion and the SAR-only U-Net tie. What the design guarantees still holds: on ten real floods the fusion model with optical removed scores , against for the SAR-only U-Net. With optical, it scores . Those labels were drawn on the optical image the model sees, though.

Measured on real data since: Stage A found that the gate opens when optical is present but barely reacts to per-pixel cloud. Under a cloud covering part of a scene, the model misses most of the flood beneath it. The radar fallback works for a whole scene without optical, not pixel by pixel. On independent maps of partly cloudy activations, the same model scores with optical and without it (descriptive).

Five panels for one synthetic chip: the optical image, its quality mask, the learned gate, the radar image and the prediction. The gate is brightest along the edge of the cloud mask.
One synthetic chip: optical image, its quality mask (white = clear), the learned gate, radar, and the prediction. The gate opens mostly along the edge of the cloud mask, not over clear ground. Gate diagnostic

4 · Real data

Ten real floods, each held out

Sen1Floods11 (Bonafilia et al., 2020) provides hand-drawn flood labels for 11 events on five continents. floodfusion keeps the labels and re-fetches every input itself. Leave-one-event-out: each flood is scored by a model built without it (eight floods to train, one to validate). Paraguay is dropped because its radar image is missing from the archive.

IoU per flood

Toggle models. Higher is better; 1 is a perfect match with the hand labels. Hover a dot for its value.

Dots for the fusion model and its optical-removed run are means over three seeds. The head-to-head tests below pair matched seeds, so their counts of wins can differ slightly from the dots.

All ten floods together

IoU at the calibrated threshold τ*, with a 95 % interval over floods, and AP, which needs no threshold.

Head to head, flood by flood

The difference in IoU between two models (B − A) with its 95 % paired interval. Verdicts use an exact sign-flip test over the ten floods, Holm-adjusted across the table.

    † Sen1Floods11's labels were drawn mostly on the Sentinel-2 image that the model also sees, so gaps involving optical partly measure agreement with the annotators. The Forlì case and the 38 independent floods below are the independent checks.
    ‡ TerraMind's encoder saw global Sentinel-1 and Sentinel-2 data in pre-training, so "never saw the flood" holds for its decoder only. It follows IBM's recipe, developed on Sen1Floods11's official split, and ran one seed.

    Does the published split flatter models?

    The official test chips come from the same floods as the training chips. Each flood's official test chips are scored twice: by the model trained on the official split, and by the model that never saw the flood. The difference also includes training-set size and calibration, so it is a protocol gap, not pure leakage.

    Does the recall guarantee carry to a new flood?

    A conformal threshold guarantees that, on average, a chip misses at most α = 10 % of its flood, but only for chips like the calibration chips. Each bar is one held-out flood's mean miss rate.

    Two things the real data revealed

    The labels follow Sentinel-2, not the radar

    Each flood's labels and optical image were moved onto the radar by one whole-pixel shift, measured from the labels' own water edges where that estimate is precise. It is two integers per flood, fixed before any model ran and the same for every model, and it is disclosed and checked independently.

    Arrows: the direction and distance each flood's labels were moved (north is up; rings at 1, 2 and 3 px, 1 px = 10 m). Blue: measured from the labels; orange: from Sentinel-2. Mekong and Somalia stayed unregistered; Bolivia and Pakistan remain uncertain. Details in the data card and the registration report.

    The labels mark water, not change

    Median change in VV backscatter on labelled flood pixels, against a same-orbit image up to 60 days earlier. Real floods usually darken by several dB. In of events the labelled water did not darken by even 1 dB: much of it was already there.

    This is why change-based rules (the physics baseline) score poorly on this benchmark while amplitude-based ones do not.

    5 · Independent check

    Forlì, May 2023: against Copernicus EMS's own maps

    The Emilia-Romagna floods triggered Copernicus EMS activation . CEMS mapped the Forlì area times with non-Sentinel radar satellites at 3 m. floodfusion ran zero-shot (trained only on Sen1Floods11) on every Sentinel-1 pass, and was scored on the km² that every full pass and every CEMS map observed.

    Drag to compare

    : the fusion model, with Sentinel-2 on tiles, against CEMS's delineation of .

    floodfusion's flood map at τ* · CEMS delineation · yellow line: edge of the region CEMS observed · background: Sentinel-1 VV, where dark means smooth, usually water. CEMS products © European Union, Copernicus Emergency Management Service.

    Flooded area over time

    On the common region. CEMS maps in blue; floodfusion's passes as points.

    Every pass against every CEMS map

    IoU at τ*. The outlined cell is the CEMS map nearest in time. Maps made days apart disagree even with each other, because the flood receded between acquisitions.

    What Forlì shows

    • Optical's value survives an independent reference. On , with Sentinel-2 on tiles, fusion scores against for the same model without optical. Its flooded area, km², matches CEMS's latest map ( km²); without optical, it maps km².
    • Without optical, the simple physics rule wins here. On (no Sentinel-2), the physics baseline scores against . Zero-shot on the Po plain, the learned radar path over-maps fields. It is not yet a drop-in radar-only product for a new region.
    • None of the CEMS maps came from Sentinel-1. Comparing them compares two products made at two instants by different sensors, so a perfect score is impossible.

    6 · The CEMS benchmark (v1.1)

    Four questions fixed in advance, answered on Copernicus EMS's maps

    Forlì is one flood. Before training a single new model, version 1.1 committed four questions and the rules for answering them to the repository (a pre-registration). They are answered on flood activations () that Copernicus EMS mapped on non-Sentinel radar satellites. of their maps were paired with a Sentinel-1 pass within 24 hours, and every model ran zero-shot. A result counts only if it holds for single activations and for the clusters of activations within 100 km and 60 days, so one storm across neighbouring regions is not counted twice.

    The four pre-registered questions

    The difference in IoU (B − A) with its 95 % paired interval, per activation (upper bar) and per cluster (lower bar). Verdicts use a sign-flip test (exact up to 20 units, Monte Carlo above), Holm-adjusted; no verdict below 8 units.

      H3 is a non-inferiority test: fusion may lose at most 0.05 IoU (the amber line), tested one-sided at 2.5 %. H1 compares two training recipes on identical Kuro Siwo chips: labels marking the water a flood brought, or all water. CEMS maps are flood maps too, so part of H1's gain is agreement of definitions. H4's conclusion is withdrawn: re-trained as its protocol describes, TerraMind beats fusion on these floods, −0.042 per activation and −0.043 per cluster, significant at both (erratum). H4's floods postdate the SSL4EO-S12 part of TerraMind's pre-training data (2019–2021), not all of it: TerraMesh runs mostly 2019–2023. The rules are in the protocol, and every change since in the deviations log.

      Every model on the same floods, by cloud cover

      Mean IoU over activations at each model's own calibrated threshold, with a 95 % interval. Choose the activations by how much of them Sentinel-2 saw clearly. Hover a bar for the value at the best single threshold.

      What it means

      • The Sen1Floods11 fusion gain is not reproduced. On Sen1Floods11, fusion beats the SAR-only U-Net by +. On independent radar-drawn maps where optical is usable, the gain is , not significant: a gain that large is ruled out, a smaller one is not. Sen1Floods11's labels were drawn on the optical image the model sees, which fits but does not prove agreement with the annotators.
      • The training data moved scores more than the architecture (descriptive). The same networks trained on Kuro Siwo's radar-drawn flood labels score , against trained on Sen1Floods11. The physics baseline, with no learning, scores . Labels, places and dataset size all differ between the two; H1 isolates the labels.
      • Partly cloudy scenes hurt fusion (descriptive). On activations 10–50 % clear, the fusion model scores with optical and run without it.
      • TerraMind's deficit was a bug. As run, fusion won at each model's own threshold (H4), while at the best single threshold TerraMind was already ahead ( against ). That TerraMind had been trained without the modality dropout its protocol states. Trained as described, it beats fusion on these floods: 0.299 against 0.258 (erratum).

      Kuro Siwo: floods labelled on radar

      Floods from the Kuro Siwo dataset (Bountos et al., 2024), in groups of floods within 100 km. Each group is tested by a model that never saw it (grouped five-fold).

      7 · Controlled experiments

      Turning one knob at a time (synthetic data)

      Real floods mix every difficulty at once. A physics-based synthetic benchmark varies one factor at a time on landscapes no model trained on. These numbers validate the pipeline; they are not accuracy claims.

      The 13-row ablation

      Each row removes or swaps one ingredient. seeds per learned row and test basins, so the intervals are indicative and no row gets a significance verdict. Click a row.

      8 · What we learned

      Findings, including the uncomfortable ones

      Training data moved scores more than the architecture

      On independent maps, the flood-label recipe beat the water-label recipe by IoU (pre-registered, supported). Kuro Siwo flood-label networks score , against for the same networks trained on Sen1Floods11 (descriptive).

      Optical's gain did not reproduce

      + IoU on Sen1Floods11, whose labels were drawn on the optical image. On independent radar-drawn maps where optical is usable: , not significant. A smaller gain is not ruled out.

      Partial cloud defeats the gate

      Under a cloud covering part of a scene, the fusion model misses most of the flood beneath it. On partly cloudy independent activations it scores with optical and without (descriptive). Without any optical it scored against the radar U-Net: non-inferior per activation, not shown per cluster.

      A frozen foundation model wins, once trained properly

      TerraMind-1.0-small scored 0.572 on the ten floods as run (three seeds; with v1.0's one), 0.597 trained as its protocol describes. On independent maps the corrected TerraMind beats the fusion model trained on the same data (0.299 against 0.258): v1.1's H4 rested on a training bug (erratum). v1.2's Arena gives it the same flood labels as ours.

      Zero-shot, learned radar over-maps

      The physics baseline () beats every Sen1Floods11-trained network on the independent floods, as it did at Forlì. A seasonal reference image helps on benchmark labels but not on Copernicus EMS's maps.

      The gate responds to presence, not quality

      On synthetic data it stayed near its starting value. On real data it opens when optical is present, but barely reacts to per-pixel cloud.

      Guarantees don't travel between floods

      Conformal recall control holds on average, but on only of new floods. Floods are not exchangeable.

      The published split's flattery is unstable

      The within-flood protocol added at most IoU for the trained models in v1.0, and up to in the v1.1 re-run. Neither is significant: one draw is not an estimate.

      Benchmarks and archives need fixing

      Sentinel-2 from 2016–2019 sits 1–3 px off the radar, and the labels follow it. The fix uses the labels, which is disclosed and checked independently. One event's radar image is missing from the archive, so that event was dropped.

      Where the map must not be used

      • Partial cloud: remove partly cloudy optical altogether, so radar maps the scene.
      • A new region, with a Sen1Floods11-trained model: on independent maps it scores below the physics baseline.
      • Dense canopy and dense urban areas: "dry" there means "not seen". They are flagged, not mapped.
      • Radar shadow and layover carry no information and are excluded.
      • Strong wind can hide open water.
      • One instant: the map is a snapshot at the acquisition time. It gives no depth and no damage assessment.

      More in the model card and the data card.

      9 · Reproduce

      Every number regenerates from a commit

      No account or API key is needed. Each report records the git commit it was made at, and the table builders refuse runs made with different code, data or test sets.

      git clone https://github.com/teo-clerk/floodfusion && cd floodfusion
      make setup && make preflight       # uv-locked environment, environment checks
      make test                          # offline test suite (CPU)
      make demo SEED_PROTOCOL=full       # synthetic benchmark: 13-row ablation, 3 seeds (~1.5 h)
      make stress                        # single-factor stress curves and the gate figure
      make s1f11 S1F11_LEARNED="4 9 14"  # Sen1Floods11 leave-one-event-out (~9 h on an 8 GB GPU)
      make forli                         # EMSR664 Forlì: every Sentinel-1 pass vs every CEMS map
      # v1.1 (~45 GPU-hours): Kuro Siwo, the CEMS benchmark, seasonal references, then every run in order
      make kurosiwo-data v11-splits
      uv run --frozen python -m floodfusion.cems_benchmark prepare
      make seasonal
      scripts/v11_queue.sh smoke         # one fold of every configuration first
      scripts/v11_queue.sh all           # every run, the CEMS tests and strata, the tables, the synthetic grid

      Sen1Floods11 declares no licence, so its labels are downloaded by each user and never redistributed, and neither are weights trained on them.

      Glossary

      Terms used on this page

      IoU (intersection over union)
      Pixels both the map and the reference call flood, divided by pixels either calls flood. 1 is a perfect match; it ignores the dry pixels both agree on.
      AP (average precision)
      Area under the precision–recall curve. It scores the ranking of probabilities and needs no threshold.
      Calibration
      Adjusting the model's scores (prior correction, temperature, Platt scaling) on validation floods so that a 0.3 means roughly a 30 % chance of flood. Only then does a cost-based threshold mean anything.
      Leave-one-event-out
      Test on one flood, validate on another, train on the rest, and repeat for every flood. No flood is ever both trained and tested on.
      Sign-flip test
      An exact permutation test: if two models were equally good, each flood's difference would be equally likely to be positive or negative. With 10 floods the smallest possible p is 2 / 2¹⁰ ≈ 0.002.
      Holm adjustment
      Corrects p-values when many comparisons are tested at once, so the chance of any false "significant" stays at 5 %.
      Conformal risk control
      Chooses a threshold on calibration chips so that the expected miss rate on a new, similar chip is at most α. "Similar" (exchangeable) is the catch.
      RTC γ⁰ (radiometrically terrain-corrected backscatter)
      Radar brightness corrected for the area each pixel covers on sloped terrain, in decibels (dB). VV and VH are the transmit/receive polarisations.
      Bragg waves
      Centimetre-scale ripples that resonate with C-band radar's ~5.5 cm wavelength and send energy back to the satellite, brightening wind-blown water.
      HAND (height above nearest drainage)
      How far a pixel sits above the stream it drains to, computed from the DEM. Low HAND is where water collects.
      STAC
      SpatioTemporal Asset Catalog: a standard way to search and describe satellite images. floodfusion both searches STAC catalogues and writes a STAC Item for its product.
      COG (Cloud-Optimized GeoTIFF)
      A GeoTIFF laid out so that a viewer can stream just the part it needs over HTTP.
      Zero-shot
      Applied to events the model never saw in training, with no fine-tuning. (Five CEMS pairs lie where Kuro Siwo models trained on other events; a sensitivity analysis drops them.)
      Pre-registration
      Writing down the questions, the test data and the rules for answering them, and committing them before any result exists, so the results cannot shape the questions.
      Non-inferiority test
      Asks whether a model is no worse than another by more than a stated margin, here 0.05 IoU. Passing it does not mean "better", only "not meaningfully worse".
      Copernicus EMS
      The Copernicus Emergency Management Service, whose rapid-mapping service delineates floods for civil protection within hours of an activation.